West Coast vs. East Coast: The Fight for Container Volume
By Pierson Gruettner
Published January 25, 2023
During peak season in 2021, there were up to 100 vessels off the coast of California waiting to berth in the Port of Los Angeles (including Long Beach). This caused delays and monetary losses for importers waiting to receive their freight that was loaded into a container on one of these vessels. After this occurrence, it led to a reconsideration of routing options into the United States other than the Port of Los Angeles.
The Port of Los Angeles handled 16% of the US’s import and export containers or 6.4 million Twenty-foot Equivalent Units (TEU) in 2021. The Port of New York and New Jersey handled 8.9 million TEU’s in 2021 which was an all-time record for the port. The East Coast ports proved during a crunch and crisis that they were a viable option by handling a higher volume of containers with fewer delays than the Port of Los Angeles.
The Port of Los Angeles is the gateway to the United States from Asia with the shortest transit times on the water. China (19% of imports) was the leading importer in 2021 followed by Mexico (14%), Canada (13%), Japan (4.9%), Germany (4.8%), and Vietnam (3.8%). After the containers arrive at the port they must continue their travels into the US via rail (sometimes truck) or brought to a Distribution Center (DC) for further breakdown and transportation.
There are different figures and reports, but depending on how the US is split 58% to 80% of the population resides in the East. The transit time from China to Los Angeles via vessel is approximately 15 to 20 days, and from China to New York is approximately 30 to 40 days. When a container arrives in Los Angeles, and statistically speaking based on where the US’s population density resides, the freight within the container is more likely to move to the East than the West. There are additional transit days for the movement of freight from West to East, which can be approximately 5 to 10 days.
Since the shift of freight from the West Coast of the US to the East to accommodate the denser population of the United States, the Port of New York and New Jersey are making attempts to maintain the freight that was routed from the West Coast during the peak season of 2021.
However, the Port of Los Angeles is back to the number one spot in 2022 for TEU volume and plans to increase the efficiency of the port through technology and expansion. As long as there aren’t 100 vessels waiting to berth; the Port of Los Angeles will be the highest volume port in the United States since infrastructure and the supply chain have been built around it.
Sources
Facts and Figures | Statistics | Port of Los Angeles. (n.d.). Www.portoflosangeles.org. Retrieved January 25, 2023, from https://www.portoflosangeles.org/business/statistics/facts-and-figures#:~:text=The%20Port%20of%20Los%20Angeles%20had%20a%2016%25%20market%20share
PORT AUTHORITY REPORTS FACILITY VOLUMES FOR DECEMBER AND FULL YEAR 2021. (n.d.). Www.panynj.gov. Retrieved January 25, 2023, from https://www.panynj.gov/port-authority/en/press-room/press-release-archives/2022-press-releases/PORT-AUTHORITY-REPORTS-FACILITY-VOLUMES-FOR-DECEMBER-AND-FULL-YEAR-2021.html#:~:text=On%20an%20annual%20full%20year
Video explains US population density – Upworthy. (n.d.). Www.upworthy.com. Retrieved January 25, 2023, from https://www.upworthy.com/us-population-map
United States Imports By Country. (2018). Tradingeconomics.com. https://tradingeconomics.com/united-states/imports-by-country
China’s Growing Economic Clout: The Los Angeles Port – CMHI. (n.d.). Www.cmhi.com.hk. Retrieved January 25, 2023, from https://www.cmhi.com.hk/chinas-growing-economic-clout-the-los-angeles-port/
U.S. 2022 Ports Update | Industrial Insights | United States | Cushman & Wakefield. (2022). Cushman & Wakefield. https://www.cushmanwakefield.com/en/united-states/insights/north-american-ports-report
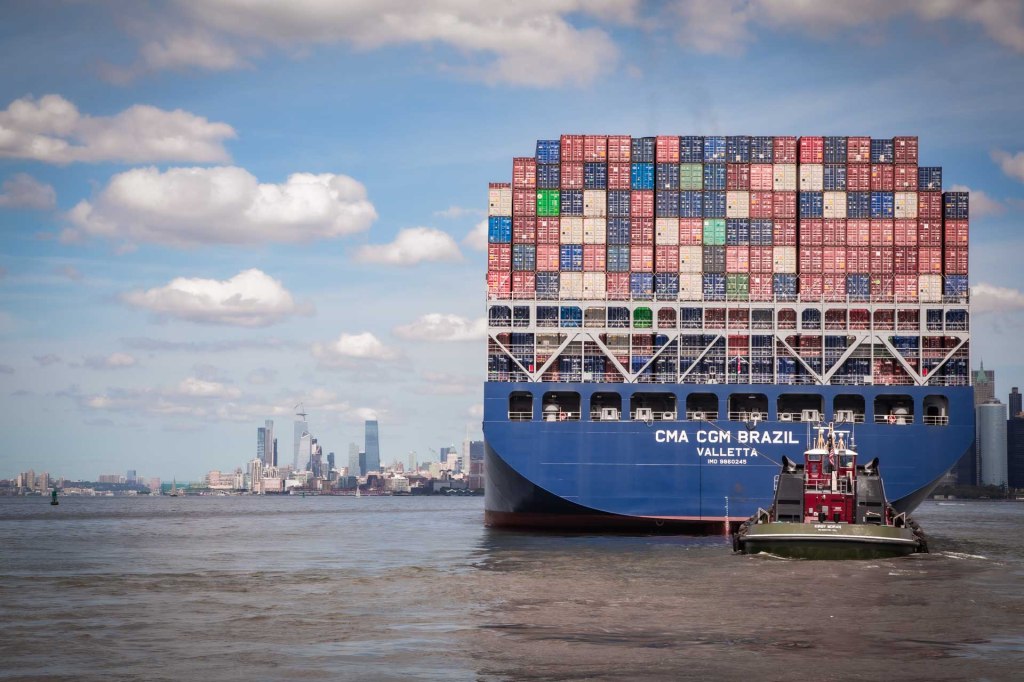
“The CMA CGM Brazil calls at Port of New York & New Jersey” byPortAuthorityNYNJis licensed underCC BY-NC-ND 2.0.
